Facts & Resources
High dollar risk to Australian Farmers using electromagnetic induction (EM) mapping
Did You Know?
Australian farmers risk losing large amounts of money if there is an over-reliance on EM survey data to indicate where soil sampling and soil improvement should take place across their paddocks
Precision Agriculture (PA) provides a broad range of interesting and powerful tools for farmers and their advisers. Highlights include grain yield and surface elevation mapping, and satellite and drone imagery to monitor crop performance.
Many Australian farmers – particularly dryland grain producers – hire advisers who use electromagnetic induction (EM) mapping to help with definition of “management zones” where soil sampling should take place. However, they need to be cautious of advice-givers who claim that a single PA sensor such as EM is capable of delivering the “silver bullet” for soil assessment and management.
EM signals are affected by clay content, salinity (electrical conductivity; EC) and water content of soil profiles. CSIRO (‘Guidelines for Surveying Soil and Land Resources’, 2008, p. 275) have noted that “… total reliance on EM survey as a surrogate for soil survey is unwise, as even a rudimentary understanding of the technique and insight into natural soil variation will show.”
Nevertheless, the sales pitch from EM-providers can be persuasive:
- Low cost per hectare;
- Colourful maps with lots of spatial detail;
- It’s modern – copious amounts of data are provided that allow growers to be part of the ‘Big Data’ revolution;
- Many other farmers are using EM.
There are specific circumstances where EM works well because of a genuinely strong correlation between EM signals and the soil factor of interest:
- Where there is a sampling location in a paddock known to be saline, EM surveys are valuable for mapping the boundaries of the problem area.
- In the NSW Riverina, leaky zones within rice fields usually have a lower clay content and a lower degree of salinity than nearby heavy clay areas, so zone boundaries can be mapped accurately using EM maps.
- In the cotton industry, EM surveys highlight zones with sandy/gravelly subsoil that need to be avoided when planning the location of water storages.
- Western Australian soil scientists have indicated that ‘depth to clay’ can be predicted by EM where deep mixing is under consideration to overcome water repellence problems in sandy topsoil.
Many situations exist, however, where EM surveys can cost farmers dearly. Uneven rainfall (eg. heavy rain from a thunderstorm occurring in a narrow strip across a wheat paddock) and runoff inflows can complicate EM map interpretation, and often there are crop growth factors that are unrelated to soil constraints but affect residual soil moisture, eg. frost damage and uneven weed/pest pressures. Selection of soil sampling sites in a cropping paddock for management zone creation based on EM-directed approaches therefore can be less accurate (ie. more biased) for soil constraint mapping than grid sampling. Farmers need to be wary of EM proponents who try to convince them that the use of EM surveys will, at least, give them something that is better than a more random approach when planning the locations of soil sampling sites.
Liebig’s Law often is overlooked. We need to remember that if there are say four major soil constraints restricting crop growth at a particular location and only three of them are corrected, poor crop growth will continue to be a problem because of the fourth constraint.
Soil factors of relevance to grain growers often each have their own separate and distinctive patterns of variation across paddocks. Therefore, it is close to impossible for a single remote sensing system such as EM to accurately map each of the key soil factors (dispersion, acidity, compaction, water holding capacity etc) simultaneously (Table 1).
Table 1. The relevance of available measurement systems for the various topsoil and subsoil constraints that Australian grain producers have to deal with.
| Soil sensing systems – will they be useful? |
Soil constraints affecting grain producers |
||||||||
| Dispersion / waterlogging | Acidity | Salinity | Compaction | Excessive flatness / waterlogging | Poor water holding capacity (sand/gravel) | Water repellence |
Nutrient deficiency | ||
| High sodicity | Low EC | ||||||||
| EM | sometimes | sometimes | sometimes | works well | sometimes | sometimes | sometimes | unlikely | unlikely |
| RTK elevation | sometimes | unlikely | unlikely | unlikely | unlikely | works well | sometimes | unlikely | unlikely |
| Bare soil colour air photos | sometimes | sometimes | sometimes | sometimes | sometimes | sometimes | sometimes | unlikely | unlikely |
| Radiometrics | maybe | maybe | maybe | maybe | unlikely | unlikely | maybe | maybe | maybe |
| Farmer observations | sometimes | sometimes | sometimes | sometimes | sometimes | works well | sometimes | sometimes | sometimes |
| Soil pit observations / lab analysis (>one metre deep), with pit location guided by farmer observations & PA yield maps | works well | works very well (can assess degree of dispersion on undisturbed aggregates) | works well | works well | works well | works very well (can assess surface slope and subsoil mottling patterns) | works very well (can assess subsoil gravel content, even if the fragments are large) | works well | works well |
| Soil coring / lab analysis (>one metre deep), with core location guided by farmer observations & PA yield maps | works well | works well | works well | works well | sometimes | works well | problems where large gravel fragments prevent core penetration | works well | works well |
Where only a small degree of correlation does exist, for example, between EM data and sodicity (and the associated issues of dispersion and the ‘electrochemical stability index’; ESI) for a particular paddock, the sodicity predictions from EM will be too inaccurate to be useful for mapping and amelioration planning at that location. Images of bare soil colour collected via a drone or satellite can be more useful for sodicity mapping – and the planning of gypsum/lime/organics application – than EM maps.
The spatial detail on EM maps is of course useless and a waste of dollars if accompanied by unacceptable estimation errors for the soil factors under consideration. The cost to farmers of a failed EM-based soil assessment is twofold:
- The expense of the EM survey itself and associated attempts at interpretation, and;
- The value of ongoing lost grain production and unnecessary inputs associated with a failure to accurately assess and then professionally manage all relevant soil constraints.
Farm advisors without adequate training in soil science run the risk of being sued for malpractice if their clients lose money because of incorrect planning of soil assessment and management. Therefore advisors only having a clear understanding of PRECISION AGRICULTURE ENGINEERING and AGRONOMY, for example, need to team up with an accredited soil scientist who has wealth of experience and knowledge about PEDOLOGY and SOIL AMELIORATION. This way, farmers will get the best possible value for the consulting fees that they pay.
‘Yield gap’ maps show that many Australian grain producers suffer large financial losses because of yield shortfalls which almost certainly are related to inaccurate assessment and poor management of their soil constraints. The losses tend to be most severe in wet years when waterlogging is a major constraint for crop production. The blend of EM surveys and ‘0-10 cm soil nutrient testing’ that is used by farmers and their advisers in some regions to guide soil management decisions clearly is inadequate.
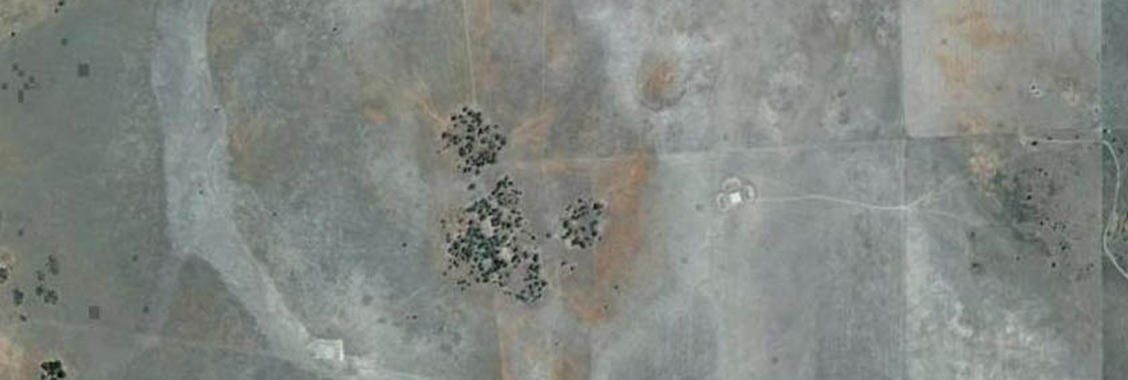
In conclusion, it is dangerous to rely exclusively on EM maps to define where to collect soil samples across crop or pasture paddocks. Pit and/or core locations for comprehensive soil assessment should instead be guided mainly by farmer observations, yield maps and aerial images showing bare soil colour (where possible) and crop/pasture/tree vigour.
But if this is too complicated, commence soil assessment for the planning of root-zone improvements by collecting topsoil, subsurface and subsoil samples on a flexible grid (spacing of about 400 metres) in at least the three most important paddocks on a farm. Analyse the soil samples then produce maps of soil structural condition, pH, salinity, organic carbon, nutrients etc. for the topsoil, subsurface and subsoil. Use remote sensing data to fill in the spatial gaps where strong correlations exist. The soil factor maps can then be converted to maps of gypsum/lime/decompaction/nutrient/organics requirements, in conjunction with ‘cost of repair’ and ‘expected profitability’ maps. Where there is poor correlation between environmental covariates (eg. EM data) and the soil variables of interest, collect and analyse soil samples from additional cores/pits on a tighter grid spacing – eg. 100 metres apart – to achieve the required accuracy.
Once the physical, chemical and biological condition of the upper half-metre or so of soil has been optimised for the crops/pasture/trees of interest, apply zone management across farms to take into account differences in features of the deep subsoil and underlying parent materials, and differences in micro-climate and groundwater/runoff dynamics associated with elevation, aspect and slope.